Institutional Investing / Economics
Infographic: Key Goods Inflation Measures Waning

Key goods inflation measures appear to be waning as supply chain index, transportation backlogs, and transportation costs fall from recent highs.
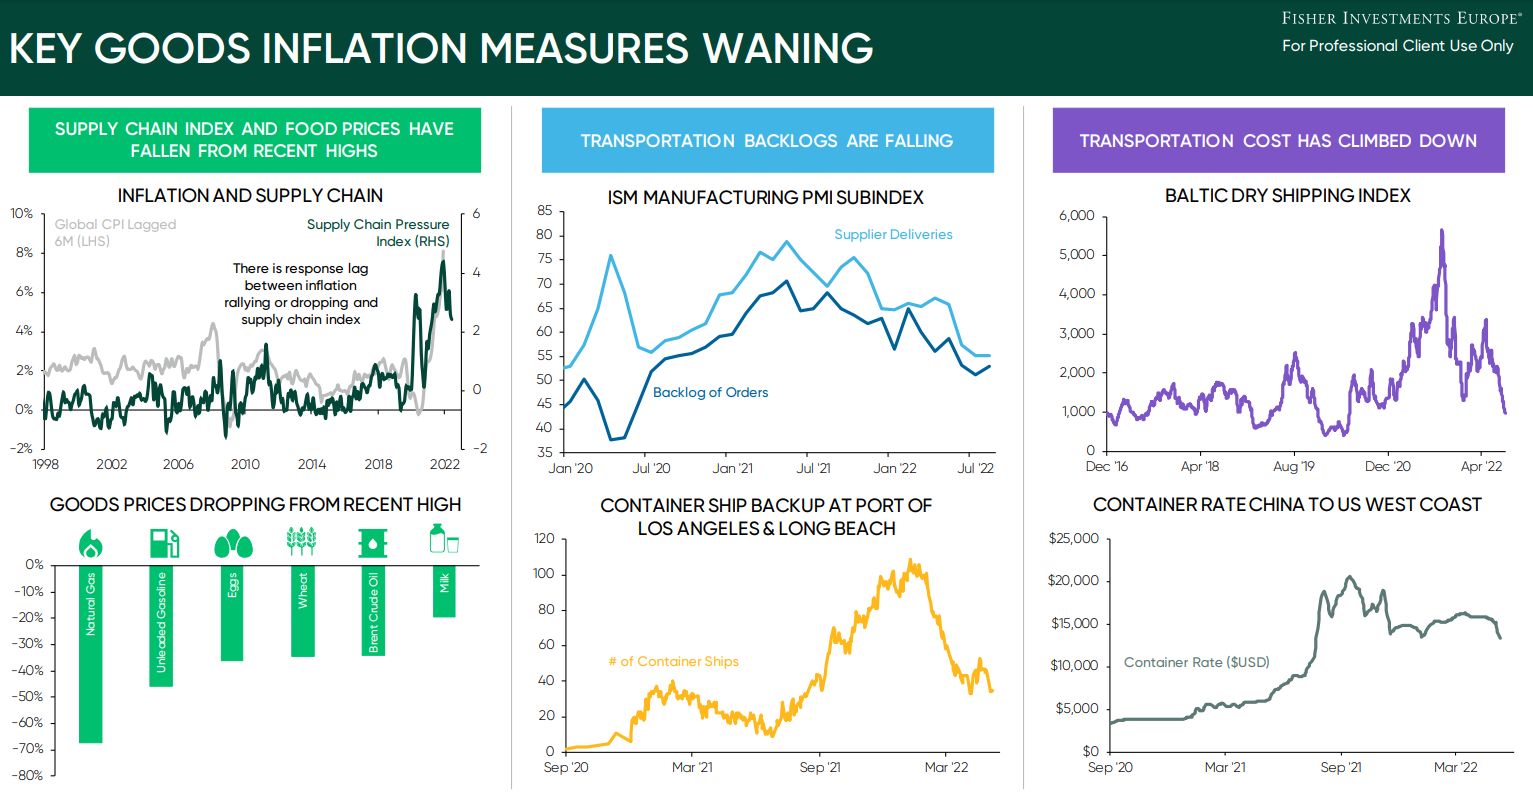
- Top Left Source: FactSet, as of 30/06/2022. Global CPI data shown as the GDP-weighted year-over-year change in most recent available CPI data for the top 30 countries by GDP, as of 31/12/2021. Global Supply Chain Pressure Index, monthly, 01/01/1998 – 30/06/2022.
- Bottom Left Source: FactSet, as of 08/09/2022. Percent change of daily closing prices since 2021 – 2022 peaks of natural gas (Henry Hub spot price, peak 17/02/2021), unleaded gasoline (S&P GSCI unleaded gasoline spot price, peak 06/06/2022), eggs (large, white, USDA, cost per dozen, peak 25/07/2022), soft red wheat (peak 17/05/2022), Crude Oil Brent Global Spot Intercontinental Exchange (peak 08/03/2022) and milk (grade A, peak 14/02/2022) through 07/09/2022.
- Top Center Source: FactSet & Institute for Supply Management, monthly, 31/12/2019 – 31/08/2022.
- Bottom Center Source: Marine Exchange of Southern California, 01/09/2020 – 06/05/2022.
- Right Top Source: FactSet, daily, 31/12/2016 – 31/08/2022.
- Right Bottom Source: Freightos, China/East China to US West Coast, 01/09/2020 - 10/05/2022.
See Our Institutional Insights
Stay on top of the latest investment trends and developments with our views and research.
Related Resources
-
Market Outlook Q1 2025 Executive Summary24/04/2025 00:00:00
-
In The News Ken Fisher: The Trump tariff turmoil is a sorry tale of misperceptions, markets and moronic maths19/04/2025 00:00:00
-
In The News Considering a dive into crypto? Clear your eyes and read this first15/03/2025 00:00:00
-
ESG Insights ESG Perspectives Newsletter H1 202510/03/2025 00:00:00


